Facility Details
-
Chart highlights peak alert issued on July 4th for predicted hours of high demand
-
Successful demand reduction was seen on all 5 peaks, averaging 374 kW/peak
-
Demand reduction will result in nearly $200,000 in savings next year in Global Adjustment
-
Comparison uses average peak demand based on previous year's PDF and an average monthly GA charge
July 4th Peak Comparison
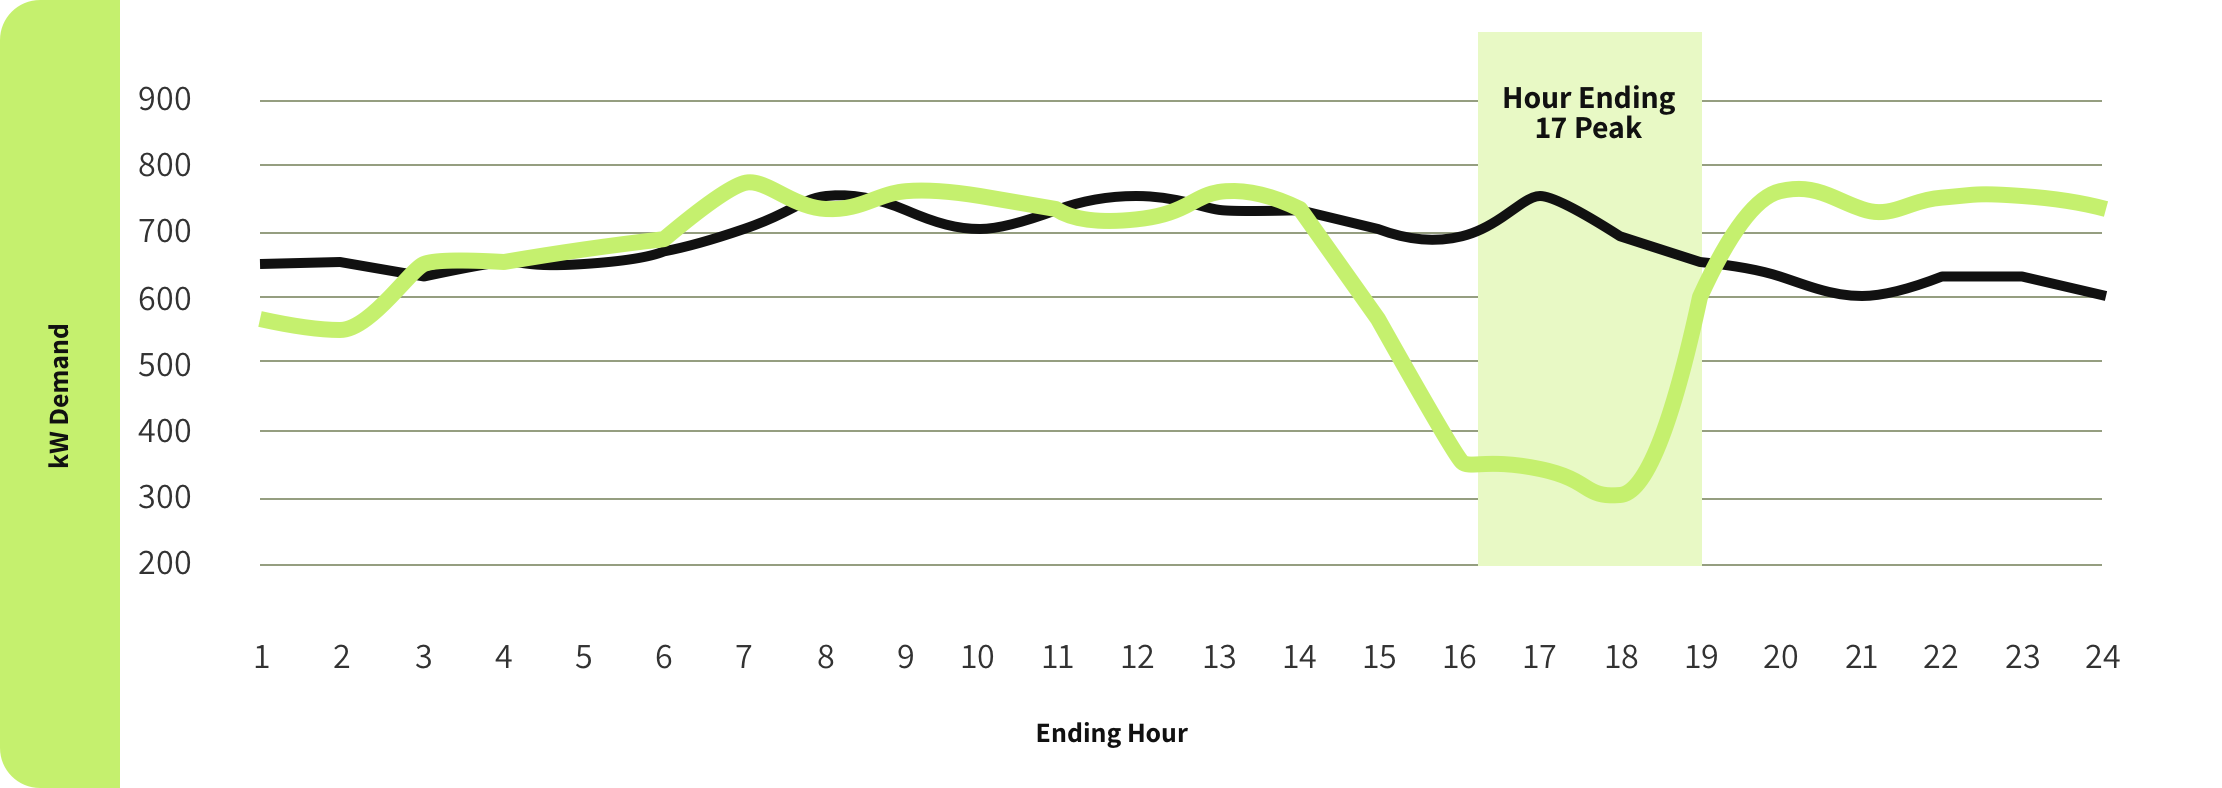

2018-2019 Base Year PDF
Without Demand Reduction
|
|
||||||||||||||||||||||||||||||||||||||||||||||||||||||||||||||||||||
2018-2019 Base Year PDF
With Demand Reduction
|
|
||||||||||||||||||||||||||||||||||||||||||||||||||||||||||||||||||||
|
REQUEST THE FULL CASE STUDY
We provide proactive solutions for commercial, industrial & agribusiness sectors in a volatile marketplace